This is sometimes a common requirement to monitor the MetaSolv application servers(weblogic server instances) and datasources which are created at time of MetaSolv installation and other custom datasources to optimize the connection pool size.
If your development/production WebLogic domain consists of multiple number (eg. 1 to 100 or 200 or so on) of managed servers then, it is difficult to see all server’s state and datasource's state at once. Weblogic Administration console is unable to show all the servers in the domain on a single page. Navigating in between also a time eating process so the monitoring through script will save lot of time and manual effort.
The architecture of weblogic server differs from project to project. In my case I have 2 domains.
1. DOMAIN1
2. DOMAIN2
and each domain has an admin , a loadbalancer server and 4 managed server like DOMAIN1 has below
1. admin
2. loadBalancer
3. srvr_1.1(managed server) on unix box 1
4. srvr_1.2(managed server) on unix box 1
5. srvr_2.1(managed server) on unix box 2
6. srvr_2.2(managed server) on unix box 2
Similarly DOMAIN2 has the same configuration.
So now I am going to explain you how I am able to put an eye on server and datasource's properties and their state.
I will summarize it in below STEPs and later provide details for each STEP.
STEP 1. Monitoring of weblogic server instances and datasources through ServerMonitor.py.
STEP 2. Ensure if SMTP is enabled on unix box.
STEP 3. Send email notification script MailServerState.py.
STEP 4. Encapsulate above scripts in a shell script ServerMonitoring.sh.
STEP 5. Put ServerMonitoring.sh on cron tab in unix box.
Now see the details in each STEP.
Create a python script to monitor all the servers in a weblogic domain. In the below script I am passing 4 parameters while calling it. Below parameters can be provided from a property file.
i) User name for Admin server console
ii) Password for Admin server console
iii) URL Admin server
iv) Name of the Domain
The o/p of the file is written in file status.log (/opt/app/Scripts/JMS/status.log) which we can use while sending email notification.
To get the status and other properties of all servers and the datasources in each server in the domain can be obtained with the following steps
1. Connect to the Admin Server
2. Navigate to the domain runtime MBean hierarchy by entering the domainRuntime command domainRuntime().
3. Navigate to ServerRuntimes to fetch the server list.
4. ServerRuntimeMBean provides methods for retrieving runtime information about a server instance.
5. Pass the serverlist to reportDomainHealth() method which iterate the loop and get the state and other mbeans(other run time mbeans like JVMRuntime, ThreadPoolRuntime) of each admin/managed server to provide monitoring properties for each server.
6. Come back to main method and pass the serverlist to reportDataSourceHealth().
7. All the datasource properties can be fetched from ServerRuntimes-->JDBCServiceRuntime-->JDBCDataSourceRuntimeMBeans mbean hieracrhy.
8. In below script it will only display the datasource details for all such datasource which are not running. In case all are working fine it will simply display "All the Datasources in instance are running fine."
9. Comeback to main method and finally disconnect.
The o/p of script should look as below.

Confirm if your email service (SMTP) is working fine.
Run below command and verify the o/p
1. Generally port 25 is reserved for SMTP and to check if port 25 is reserved for SMTP and SMTP is enabled run below command.
telnet localhost 25
if SMTP is enabled you should get below response
Else you will get below
if SMTP is disabled please go to step 2 and further steps.
2. If SMTP is not enabled run below command
svcadm enable /network/smtp
3. To confirm if SMTP service is running run below comand
svcs -a | grep smtp
4. From command 3 if you get below response
online 11:04:28 svc:/network/smtp:sendmail
Then your SMTP is enabled
5. Try running below command and you should get email.
echo "something" | mailx -s "hello" -r "abc@xyz.com"--(enter your email if here)
So now by now you know that email service is working on your machine.
Create a python script which will send the status.log file attaching in an email with some generic message to notify the team. But before that ensure that SMTP service is configured on your unix box(STEP 2).
Here in the following script you can replace the 'receiver' and 'To' address value given as abc@xyz.com with mailing address of your supporting MetaSolv monitoring team list by semicolon separation.
You can also modify below script according to your requirement. If your requirement is to send email only in case of server state is SHUTDOWN or UNKNOWN in such case you can get the server state in below script(refer from above script) and put conditions here. But my requirement is to send email with irrespective of server state after every certain amount of time.
1 thing I want to highlight here I had problems with base64 import so I print the classpath after import of smtplib and check which jython-modules.jar from classpath location it is being taken. As the base64.py in your jython-modules.jar may not have method encodestring. So please ensure it and use method mentioned in your base64.py.
Below code is quite self explanatory so in case you have issues understanding it , please leave comment.
Automate every process mentioned above using a shell script.
to Automate the above process I wrote a schell script which will run both the python files and provide the necessary parameters from property file.
Script will do below.
1. Calls the SetWLSEnv.sh to set the enviornment to execute python files.
2. Read the domain.property file.
3. Call the python scripts.
Also have a look at domain.property file.
provide user/password and other URLs as per your configurations.
You can save the files as per you convenience but in my case all the files are put together.
The Final step is to put the shell script ServerMonitoring.sh on cron job in unix box so that out email can regularly be sent to desired recipients.
to do that do below
1. To open a VI style editor.
crontab -e
2. Write below
0 0,4,8,12,16,20 * * * /opt/app/Scripts/JMS/ServerMonitoring.sh
3. Save and exit the editor.
Here completes the whole activity of monitoring weblogic servers and datasources. Now the mentioned email addresses will start receiving the email notifications with attachment status.log in their email after every 4 hours starting 00:00 AM in night which means 6 emails/per day.
Hope above helps in your server monitoring tasks, please leave your feedback or query.
If your development/production WebLogic domain consists of multiple number (eg. 1 to 100 or 200 or so on) of managed servers then, it is difficult to see all server’s state and datasource's state at once. Weblogic Administration console is unable to show all the servers in the domain on a single page. Navigating in between also a time eating process so the monitoring through script will save lot of time and manual effort.
The architecture of weblogic server differs from project to project. In my case I have 2 domains.
1. DOMAIN1
2. DOMAIN2
and each domain has an admin , a loadbalancer server and 4 managed server like DOMAIN1 has below
1. admin
2. loadBalancer
3. srvr_1.1(managed server) on unix box 1
4. srvr_1.2(managed server) on unix box 1
5. srvr_2.1(managed server) on unix box 2
6. srvr_2.2(managed server) on unix box 2
Similarly DOMAIN2 has the same configuration.
So now I am going to explain you how I am able to put an eye on server and datasource's properties and their state.
I will summarize it in below STEPs and later provide details for each STEP.
STEP 1. Monitoring of weblogic server instances and datasources through ServerMonitor.py.
STEP 2. Ensure if SMTP is enabled on unix box.
STEP 3. Send email notification script MailServerState.py.
STEP 4. Encapsulate above scripts in a shell script ServerMonitoring.sh.
STEP 5. Put ServerMonitoring.sh on cron tab in unix box.
Now see the details in each STEP.
STEP 1.
Create a python script to monitor all the servers in a weblogic domain. In the below script I am passing 4 parameters while calling it. Below parameters can be provided from a property file.
i) User name for Admin server console
ii) Password for Admin server console
iii) URL Admin server
iv) Name of the Domain
The o/p of the file is written in file status.log (/opt/app/Scripts/JMS/status.log) which we can use while sending email notification.
To get the status and other properties of all servers and the datasources in each server in the domain can be obtained with the following steps
1. Connect to the Admin Server
2. Navigate to the domain runtime MBean hierarchy by entering the domainRuntime command domainRuntime().
3. Navigate to ServerRuntimes to fetch the server list.
4. ServerRuntimeMBean provides methods for retrieving runtime information about a server instance.
5. Pass the serverlist to reportDomainHealth() method which iterate the loop and get the state and other mbeans(other run time mbeans like JVMRuntime, ThreadPoolRuntime) of each admin/managed server to provide monitoring properties for each server.
6. Come back to main method and pass the serverlist to reportDataSourceHealth().
7. All the datasource properties can be fetched from ServerRuntimes-->JDBCServiceRuntime-->JDBCDataSourceRuntimeMBeans mbean hieracrhy.
8. In below script it will only display the datasource details for all such datasource which are not running. In case all are working fine it will simply display "All the Datasources in instance are running fine."
9. Comeback to main method and finally disconnect.
file:ServerMonitor.py
# Purpose: To collect server and datasource statistics and save it to a log file
# Author: Alok Mishra
from java.util import Date
import os
adminUser=sys.argv[1]
print adminUser
adminPassword=sys.argv[2]
print adminPassword
adminURL=sys.argv[3]
print adminURL
server=sys.argv[4]
print server
def reportDomainHealth(serverList):
cmd = "echo
\================================================================================================================================================================================================
>>/opt/app/Scripts/JMS/status.log"
os.system(cmd)
cmd = "echo \"%25s %10s %15s %10s %10s %20s %10s %10s %50s" % ("Server","Threads","HoggingThreads", "IdleThreads", "QueueLength", "ThroughPut" ,"Heap_Free","State","HealthState ")+"\"
>>/opt/app/Scripts/JMS/status.log"
os.system(cmd)
cmd = "echo -------------------------------------------------------------------------------------------------------------------------------------------------------------------------------------------
>>/opt/app/Scripts/JMS/status.log"
os.system(cmd)
for i in range(len(serverList)):
if serverList[i] != 'dr--':
server_st=get('ServerRuntimes/' + serverList[i] + '/HealthState')
server_state=get('ServerRuntimes/' + serverList[i] + '/State')
server_tc=get('ServerRuntimes/' + serverList[i] + '/ThreadPoolRuntime/ThreadPoolRuntime/ExecuteThreadTotalCount')
server_hog=get('ServerRuntimes/' + serverList[i] + '/ThreadPoolRuntime/ThreadPoolRuntime/HoggingThreadCount')
server_itc=get('ServerRuntimes/' + serverList[i] + '/ThreadPoolRuntime/ThreadPoolRuntime/ExecuteThreadIdleCount')
server_ql=get('ServerRuntimes/' + serverList[i] + '/ThreadPoolRuntime/ThreadPoolRuntime/QueueLength')
server_thru=get('ServerRuntimes/' + serverList[i] + '/ThreadPoolRuntime/ThreadPoolRuntime/Throughput')
server_hpfp=get('ServerRuntimes/' + serverList[i] + '/JVMRuntime/' + serverList[i] + '/HeapFreePercent')
cmd ="echo \"%25s %10s %15s %10s %10s %20s %10s %10s %80s" % (serverList[i],str(server_tc),str(server_hog),str(server_itc),str(server_ql),str(server_thru),str
(server_hpfp)+'%',str(server_state),str(server_st))+"\" >>/opt/app/Scripts/JMS/status.log"
os.system(cmd)
cmd = "echo
\================================================================================================================================================================================================
>>/opt/app/Scripts/JMS/status.log"
os.system(cmd)
def reportDataSourceHealth(serverList):
for i in range(len(serverList)):
if serverList[i] != 'dr--':
cmd = "echo \"\t\t\t\t\t\t\t\t\tDataSource Monitoring Details on server:"+serverList[i]+" @ " + today.toString() + " \n\n"+ "\" >>/opt/app/Scripts/JMS/status.log"
os.system(cmd)
check="false"
dataSourceList=ls('ServerRuntimes/' + serverList[i] +'/JDBCServiceRuntime/' + serverList[i] + '/JDBCDataSourceRuntimeMBeans');
dataSourceList=dataSourceList.split()
for j in range(len(dataSourceList)):
if dataSourceList[j] != 'dr--':
ds_name=get('ServerRuntimes/' + serverList[i] + '/JDBCServiceRuntime/' + serverList[i] + '/JDBCDataSourceRuntimeMBeans/'+dataSourceList[j]+'/Name')
ds_state=get('ServerRuntimes/' + serverList[i] + '/JDBCServiceRuntime/' + serverList[i] + '/JDBCDataSourceRuntimeMBeans/'+dataSourceList[j]+'/State')
ds_capacity=get('ServerRuntimes/' + serverList[i] + '/JDBCServiceRuntime/' + serverList[i] + '/JDBCDataSourceRuntimeMBeans/'+dataSourceList
[j]+'/CurrCapacityHighCount')
ds_accc=get('ServerRuntimes/' + serverList[i] + '/JDBCServiceRuntime/' + serverList[i] + '/JDBCDataSourceRuntimeMBeans/'+dataSourceList
[j]+'/ActiveConnectionsCurrentCount')
ds_achc=get('ServerRuntimes/' + serverList[i] + '/JDBCServiceRuntime/' + serverList[i] + '/JDBCDataSourceRuntimeMBeans/'+dataSourceList
[j]+'/ActiveConnectionsHighCount')
ds_wshc=get('ServerRuntimes/' + serverList[i] + '/JDBCServiceRuntime/' + serverList[i] + '/JDBCDataSourceRuntimeMBeans/'+dataSourceList
[j]+'/WaitSecondsHighCount')
ds_wfccc=get('ServerRuntimes/' + serverList[i] + '/JDBCServiceRuntime/' + serverList[i] + '/JDBCDataSourceRuntimeMBeans/'+dataSourceList
[j]+'/WaitingForConnectionCurrentCount')
if (str(ds_state)!="Running"):
if (check!="true"):
cmd = "echo \"%25s %15s %20s %30s %20s %20s %25s" %("Name", "State", "Capacity", "ActiveConnectionsCurrentCount",
"ActiveConnectionHighCOunt", "WaitSecondsHighCount", "WaitingForConnectionCurrentCount") +"\">>/opt/app/Scripts/JMS/status.log"
os.system(cmd)
check="true"
cmd = "echo \"%25s %15s %20s %30s %20s %20s %25s" %(str(ds_name), str(ds_state), str(ds_capacity), str(ds_accc), str(ds_achc), str(ds_wshc), str
(ds_wfccc)) +"\">>/opt/app/Scripts/JMS/status.log"
os.system(cmd)
if(check=="false"):
cmd = "echo \"All the Datasources in instance are running fine."+ "\" >>/opt/app/Scripts/JMS/status.log"
os.system(cmd)
cmd = "echo
\================================================================================================================================================================================================
>>/opt/app/Scripts/JMS/status.log"
os.system(cmd)
today=Date()
if __name__== "main":
cmd = "echo \"\t\t\t\t\t\t\t\t\t"+server+" Server Monitoring Details: @ " + today.toString() + " \n\n"+ "\" >>/opt/app/Scripts/JMS/status.log"
os.system(cmd)
connect(adminUser,adminPassword,adminURL)
domainRuntime()
serverList=ls('ServerRuntimes');
serverList=serverList.split()
reportDomainHealth(serverList)
reportDataSourceHealth(serverList)
disconnect()
The o/p of script should look as below.

STEP 2.
Confirm if your email service (SMTP) is working fine.
Run below command and verify the o/p
1. Generally port 25 is reserved for SMTP and to check if port 25 is reserved for SMTP and SMTP is enabled run below command.
telnet localhost 25
if SMTP is enabled you should get below response
Trying 127.0.0.1...
Connected to localhost.
Escape character is '^]'.
Connected to localhost.
Escape character is '^]'.
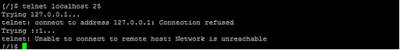
Else you will get below
if SMTP is disabled please go to step 2 and further steps.
2. If SMTP is not enabled run below command
svcadm enable /network/smtp
3. To confirm if SMTP service is running run below comand
svcs -a | grep smtp
4. From command 3 if you get below response
online 11:04:28 svc:/network/smtp:sendmail
Then your SMTP is enabled
5. Try running below command and you should get email.
echo "something" | mailx -s "hello" -r "abc@xyz.com"--(enter your email if here)
So now by now you know that email service is working on your machine.
STEP 3.
Create a python script which will send the status.log file attaching in an email with some generic message to notify the team. But before that ensure that SMTP service is configured on your unix box(STEP 2).
Here in the following script you can replace the 'receiver' and 'To' address value given as abc@xyz.com with mailing address of your supporting MetaSolv monitoring team list by semicolon separation.
You can also modify below script according to your requirement. If your requirement is to send email only in case of server state is SHUTDOWN or UNKNOWN in such case you can get the server state in below script(refer from above script) and put conditions here. But my requirement is to send email with irrespective of server state after every certain amount of time.
1 thing I want to highlight here I had problems with base64 import so I print the classpath after import of smtplib and check which jython-modules.jar from classpath location it is being taken. As the base64.py in your jython-modules.jar may not have method encodestring. So please ensure it and use method mentioned in your base64.py.
Below code is quite self explanatory so in case you have issues understanding it , please leave comment.
file:MailServerState.py
#!/usr/bin/python
# Purpose: Send email for server status
# Author: Alok Mishra
import smtplib
import base64
import time
Date = time.ctime(time.time())
filepath = "/opt/app/Scripts/JMS/status.log"
filename= "status.log"
# Read a file and encode it into base64 format
fo = open(filepath, "rb")
filecontent = fo.read()
encodedcontent = base64.encodestring(filecontent) # base64
sender = 'MetaSolvAdministrator'
reciever = 'abc@xyz.com'
marker = "AUNIQUEMARKER"
body ="""
Hi All, \n\nPlease find the monitoring details for all MetaSolv domains as attached.\n\n
Regards\nThis is an automated email notification. \nPlease do not reply. Contact Application Support Team."""
# Define the main headers.
part1 = """From: MetaSolvAdministrator
To: abc@xyz.com
Subject: WLS status for all M6 Domains of PROD Environment @ %s
MIME-Version: 1.0
Content-Type: multipart/mixed; boundary=%s
--%s
""" % (Date,marker, marker)
# Define the message action
part2 = """Content-Type: text/plain
Content-Transfer-Encoding:8bit
%s
--%s
""" % (body,marker)
# Define the attachment section
part3 = """Content-Type: multipart/mixed; name=\"%s\"
Content-Transfer-Encoding:base64
Content-Disposition: attachment; filename=%s
%s
--%s--
""" %(filename, filename, encodedcontent, marker)
message = part1 + part2 + part3
try:
smtpObj = smtplib.SMTP('localhost')
smtpObj.sendmail(sender, reciever, message)
print "Successfully sent email"
except Exception:
print "Error: unable to send email"
STEP 4.
Automate every process mentioned above using a shell script.
to Automate the above process I wrote a schell script which will run both the python files and provide the necessary parameters from property file.
Script will do below.
1. Calls the SetWLSEnv.sh to set the enviornment to execute python files.
2. Read the domain.property file.
3. Call the python scripts.
file: ServerMonitoring.sh
# Purpose: To call python scripts for servermonitoring for all the servers
# Author: Alok Mishra
#! /bin/sh
WL_HOME="/opt/app/mss/bea/wlserver_10.3"
# set up class path
. "${WL_HOME}/server/bin/setWLSEnv.sh"
. /opt/app/Scripts/JMS/domain.properties
echo $username
echo $password
echo $DOMAIN1AdminURL
echo $DOMAIN2AdminURL
cat /dev/null > /opt/app/mssnas/m6config/Scripts/JMS/status.log
java weblogic.WLST /opt/app/Scripts/JMS/ServerMonitor.py $username $password $DOMAIN1AdminURL DOMAIN1
java weblogic.WLST /opt/app/Scripts/JMS/ServerMonitor.py $username $password $DOMAIN2ADMINURL DOMAIN2
Also have a look at domain.property file.
provide user/password and other URLs as per your configurations.
username=weblogic
password=weblogic
DOMAIN1AdminURL=t3://adminserverURLfor domain1:adminserverPort for domain1
DOMAIN2AdminURL=t3://adminserverURLfor domain1:adminserverPort for domain2
password=weblogic
DOMAIN1AdminURL=t3://adminserverURLfor domain1:adminserverPort for domain1
DOMAIN2AdminURL=t3://adminserverURLfor domain1:adminserverPort for domain2
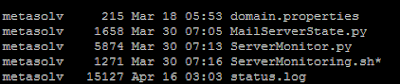
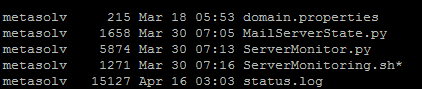
You can save the files as per you convenience but in my case all the files are put together.
STEP 5.
The Final step is to put the shell script ServerMonitoring.sh on cron job in unix box so that out email can regularly be sent to desired recipients.
to do that do below
1. To open a VI style editor.
crontab -e
2. Write below
0 0,4,8,12,16,20 * * * /opt/app/Scripts/JMS/ServerMonitoring.sh
3. Save and exit the editor.
Here completes the whole activity of monitoring weblogic servers and datasources. Now the mentioned email addresses will start receiving the email notifications with attachment status.log in their email after every 4 hours starting 00:00 AM in night which means 6 emails/per day.
Hope above helps in your server monitoring tasks, please leave your feedback or query.
No comments:
Post a Comment